What is OpenTelemetry?
Short answer: it’s super cool! Long answer: read below.
OpenTelemetry (otel in short) is a recent project developed under the umbrella of the Cloud Native Computing Foundation. Otel is trying to solve the problem of application observability by defining a unified approach to tracing, context propagation and metrics. These three aspects have been historically implemented using a number of libraries and tools (e.g. Zipkin, Jaeger, Prometheus), and very often having to code specific behaviour in the application to be observed.
OpenTelemetry tries to provide a unified approach and to be extremely simple to adopt at the same time. In most cases OpenTelemetry can be enabled on an existing Java application without requiring any change in the application source code!
In fact, OpenTelemetry provides a Java Virtual Machine agent which will modify your application binaries at run-time. The approach is the same of profilers; profilers use a JVM agent to modify the Java bytecode to be able to count method invocations and time method executions. Bytecode manipulation performed at run-time in this way is called dynamic instrumentation or simply instrumentation.
OpenTelemetry revolves around the idea that every modern application is created using popular frameworks (Spring, JavaEE …) and libraries (Hibernate, OKHttp, Jersey …). At run-time, the otel agent will alter the code of such frameworks and libraries to make them perform traces, propagate contexts and compute metrics.
OpenTelemetry supports all major programming languages and run-times, but this post will focus on Java. Let’s see a couple of examples, based on OpenTelemetry 1.9.1.
Tracing
Let’s have a very simple Spring Boot Hello World application. When the /hello endpoint is invoked, the application will perform a HTTP call to get a remote resource using OKHttp and write to the respone the size of the resource:
@SpringBootApplication
@RestController
@EnableAutoConfiguration
@ServletComponentScan
public class DemoApplication {

    public static void main(String[] args) {
        SpringApplication.run(DemoApplication.class, args);
    }

    @GetMapping("/hello")
    public String hello() throws IOException {

        OkHttpClient client = new OkHttpClient.Builder().build();

        Request request = new Request.Builder()
                .url("http://www.example.org/index.html").build();

        Call call = client.newCall(request);
        Response response = call.execute();
        long size = response.body().contentLength();
        response.close();

        return String.format("index.html file size is %s!", size);
    }
}
So how do we enable tracing in this application? Well, we just need to run the application with the OpenTelemetry agent:
java  -javaagent:/path/to/opentelemetry-javaagent.jar
      -Dotel.resource.attributes=service.name=myservice
      -Dotel.traces.exporter=zipkin
      -Dotel.exporter.zipkin.endpoint=http://zipkin_hostname:9411/api/v2/spans
      <...other application parameters..>
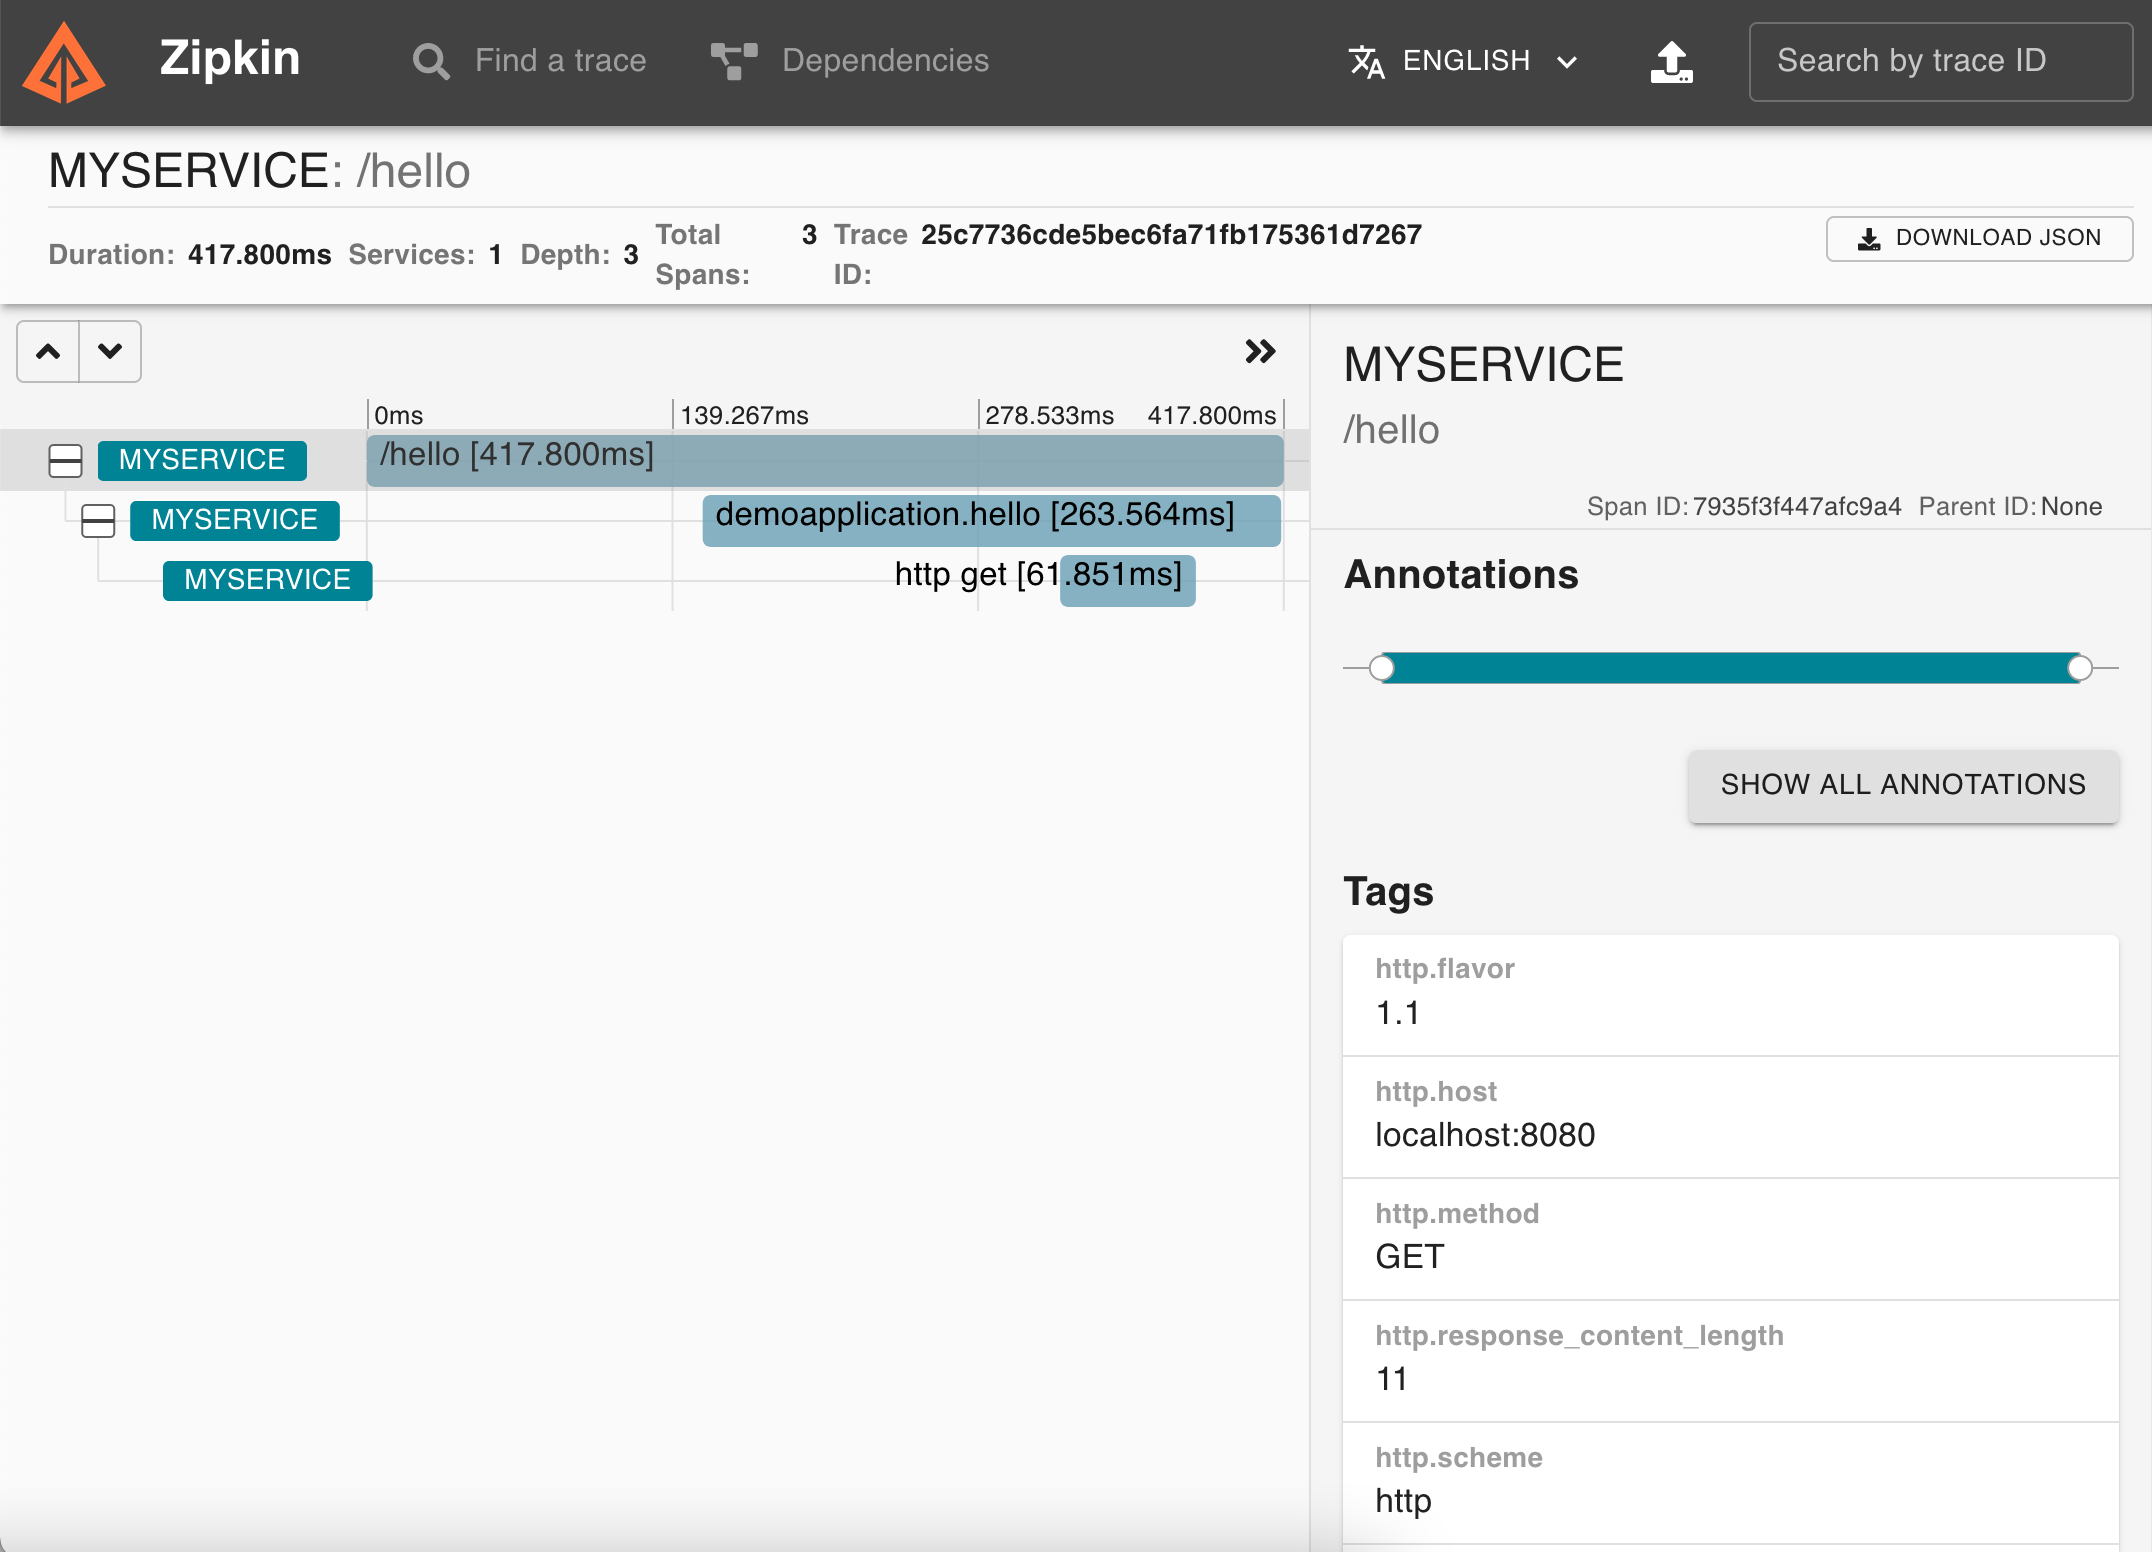
The agent is configured via environment variables or system properties or a configuration file. In the above example a system property is used to annotate this application traces with metadata (otel.resource.attributes), to ask otel to export traces in zipkin format (otel.traces.exporter) and to specify the zipkin server endpoint (otel.exporter.zipkin.endpoint). When the application is run, after the first invocation of the /hello endpoint the following will be visibile in zipkin:

Cool isn’t it? If the application used Hibernate, JDBC or other popular libraries and standards they would show up in the traces as well!!
Context propagation
Context propagation is very useful in distributed systems such as applications built with microservices. Context propagation permits to correlate the invocations that are happening between the different microservices. This is typically achieved by adding custom headers to HTTP request. The headers carry unique identifiers of the original request that triggered the cascade invocations and are propagated across all microservices. Within each service they can be added to log, audit or anything else and in this way you will be able to correlate all executions. So how do we add context propagation to our application?
java  -javaagent:/path/to/opentelemetry-javaagent.jar
      -Dotel.resource.attributes=service.name=myservice
      -Dotel.traces.exporter=zipkin
      -Dotel.exporter.zipkin.endpoint=http://zipkin_hostname:9411/api/v2/spans
      -Dotel.javaagent.extensions=/path/to/opentelemetry-extension-trace-propagators-1.9.1.jar
      -Dotel.propagation.enabled=true
      -Dotel.propagators=b3multi
      <...other application parameters..>
First we need to tell the agent to load the context propagation extension (otel.javaagent.extensions), second we need to enable propagation (otel.propagation.enabled) and third we need to choose the header format (otel.propagators). In this example we are using the Zipkin B3 headers.
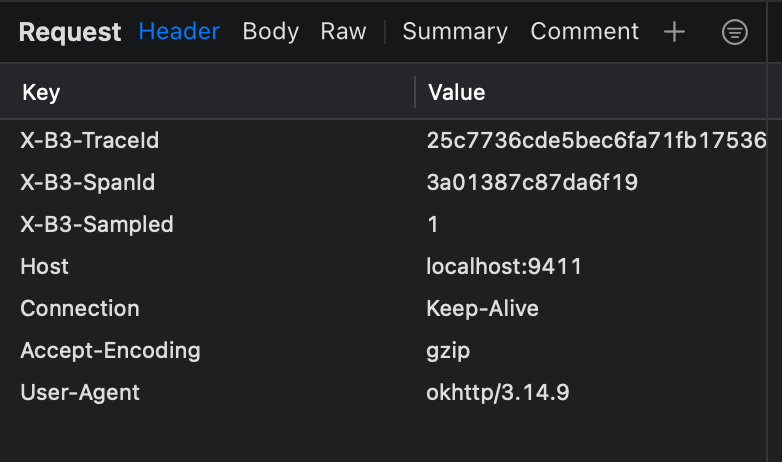
Now, OpenTelemetry will ensure that every time our application serves a request the context is created, plus otel will instrument the OkHTTP code to guarantee that the headers are forwarded to “www.example.org”, as visible in the screenshot of my HTTP proxy below:

Metrics
At the time of writing, support for metrics is still beta in OpenTelemetry, so I will not discuss it. I may add a follow up post when the implementation is finalised.